With the market pulling back now is the time to pay special attention to flaws in chart patterns. A few such flaws showed up in the recent pattern formed in the $GS stock daily price action. Check it out:
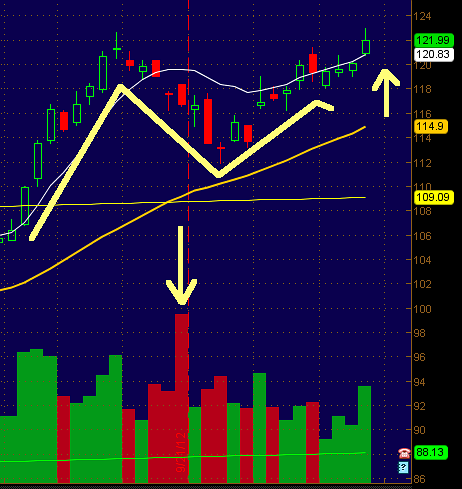
To someone paying attention this false breakout Thursday 10-11-12 was not one to be bought. As the yellow arrow pointing to the big red volume bar points out there was a volume flaw in the formation of the left side of the cup. Volume should decrease as the left side of a cup forms. Another flaw is the shape of the cup it's self. The sharp "V" shape pointed out by the yellow outline is a major flaw. The yellow arrow to the right of the chart pointing up draws our attention to another flaw in the base. The stock seemed to try to form a handle to the cup, but instead of floating down it floated up. The handle should float down (but no more than 4 or 5% down on small cups on daily charts.)
These are tell tail signs that the pattern is flawed and prone to break down. This is especially true of these cups or cup & handle patterns that form quickly on daily charts. Some say a true cup and handle or cup takes 8 to 12 weeks for the cup and one to four weeks for the handle. The thing is we see These patterns work on smaller time frames all the time. The key is where you may be able to overlook a flaw here and there on the traditional longer time framed Cup & Handle patterns the shorter formed ones must be perfect because they have a greater chance of failing. Look what happened to Thursday's false breakout:
These are tell tail signs that the pattern is flawed and prone to break down. This is especially true of these cups or cup & handle patterns that form quickly on daily charts. Some say a true cup and handle or cup takes 8 to 12 weeks for the cup and one to four weeks for the handle. The thing is we see These patterns work on smaller time frames all the time. The key is where you may be able to overlook a flaw here and there on the traditional longer time framed Cup & Handle patterns the shorter formed ones must be perfect because they have a greater chance of failing. Look what happened to Thursday's false breakout:
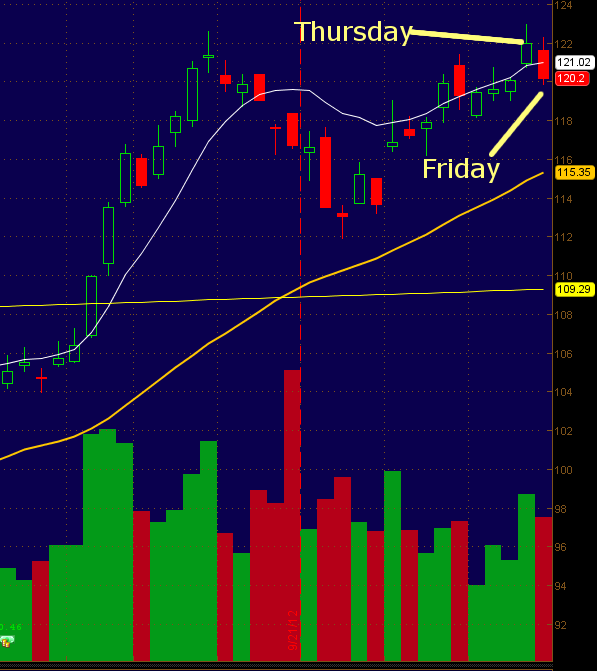
Womp, Womp, Wooommppp. If you bought Thursday thinking this was a valid cup & handle your trapped on Friday and if you were astute enough to get out Friday with minimal damage you should be proud of yourself even if you fell for the banana in the tail pipe at least you understood what was happening and got out. As you can see Friday happened on lower volume. I think this is because unlike the astute many who bought Thursday were paralyzed Friday or stunned by the drop Friday and were lulled into inaction. Come Monday I think they'll regret that inaction.
There are concrete rules for the longer term Cup & Handle pattern that goes like this. There should be a rally to a new swing high, a decline of 20 to 40%, a bottoming out sideways action followed by a run back up to the high but usually not higher and all this is over 8 to 12 weeks. Then you should see a pull back of 8 to 20% in one to four weeks. The buy point is the high in the last pullback or handle. The breakout MUST happen on big volume at least 40% higher than average.
On smaller time frames the rules aren't so concrete meaning the percentages vary but the volume metrics and geometrical shape of the pattern do not. The cup shouldn't be so deep that it retraces past the 61.8% Fib of the run up. Same goes for the handle in regards the the right side of the cup. These things will be easier to spot the more you look at charts.
The market is the only true teacher of the markets traders. There's an old saying the Japanese use that goes "市場では市場を参照してください" which means "Consult the markets on the market" this is the best advice anyone can give you concerning the markets traders and it makes a world of sense to take heed to this. So, stay on the charts traders! And good luck and happy hunting!

 RSS Feed