I think the answer is yes. With a yield of just 2.93% and a Federal Reserve focused on unemployment and creating inflation instead of fighting it, you gotta expect yields to rise from here. Below is the monthly $ZB_f chart and it's showing topping signs.
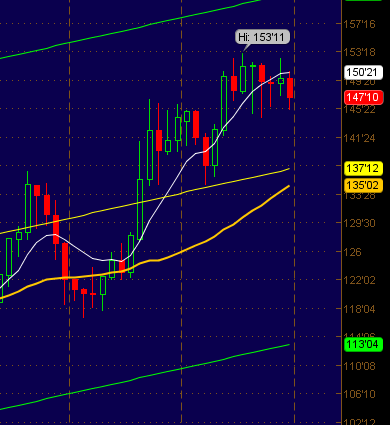
The first thing that jumps out at me is the distance between price and the lower moving average (the yellow line) which is a simple 34 period moving average.
The white line is a double exponential 21 period moving average. The second thing that jumps out at me is that price is trading under it, and tried hard to get back above it last month and couldn't.
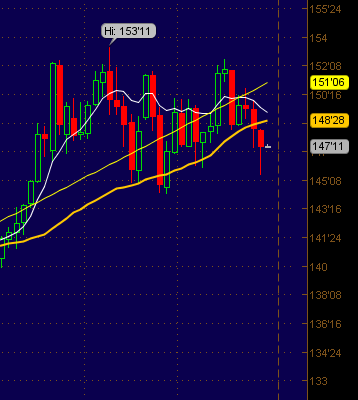
The channel you see is a two standard deviation channel with the middle line being the mean. It looks like price wants to revert to that line and the 34 MA at the same time. The topping action can be seen clearer on thee weekly chart below.
The white line is a double exponential 21 period moving average. The second thing that jumps out at me is that price is trading under it, and tried hard to get back above it last month and couldn't.
The channel you see is a two standard deviation channel with the middle line being the mean. It looks like price wants to revert to that line and the 34 MA at the same time. The topping action can be seen clearer on thee weekly chart below.
It won't be a straight line down as a LOT of traders are anchored long this trade. Not to mention the fact that Fiscal Cliff turmoil is still front and center and will be effecting the market for some time.
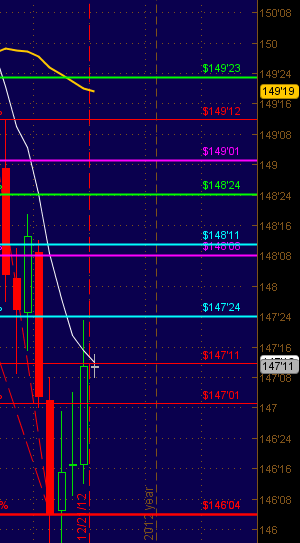
With that in mind, below are some Fib resistance levels I'll be using to short $ZB_f
With that in mind, below are some Fib resistance levels I'll be using to short $ZB_f
This trade should be good for the whole 2013. I think 4% on the 30 year by June next year isn't a crazy statement to make. Last June the 30 year yield was as high as 4.37% and I'm looking for a repeat of that once the fiscal cliff gets resolved, and I do believe it get's resolved.
In the mean time, $148'11 on $ZB_f wouldn't surprise me. $148'24 is a perfect short for me, but, and there's always a but... But, there is a trend line break recently that could be a short opp. Here's what that looks like
In the mean time, $148'11 on $ZB_f wouldn't surprise me. $148'24 is a perfect short for me, but, and there's always a but... But, there is a trend line break recently that could be a short opp. Here's what that looks like
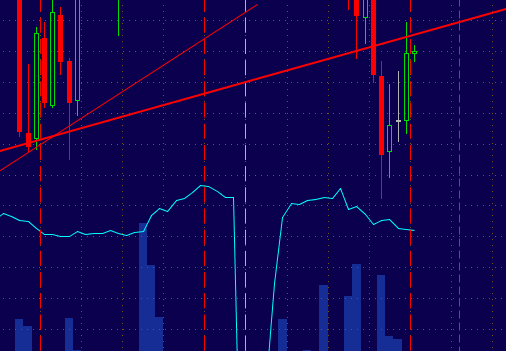
Since it's an upward sloping line it gets higher as time passes but it's coming in around 147'18 to 147'19 level.
With this short the 30 yr UST trade being nicknamed the "widow maker" from killing so many traders, it has the potential to move fast once more traders realize the coast is clear. It also has the potential to back fire and make a few more widows before it's all said and done. So be patient and wait for the right time to put the trade on (at resistance) and keep your stops as tight as possible ( 10 or so ticks above resistance.)
Good luck and happy hunting!

 RSS Feed