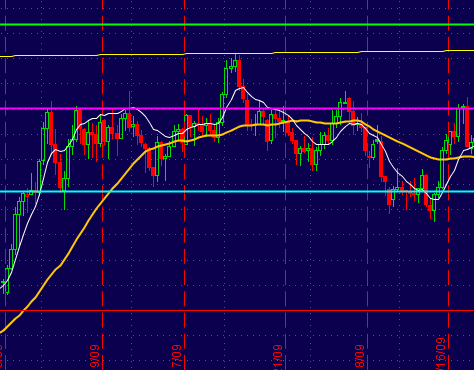
Looking at the GBP/USD pair and one of the first things that jumps out at me is a huge channel that price has been obeying since late last year. Here's what the start of it looks like (click to enlarge):

To the far left is September 2011, to the far right is February 2012. You can see how price is listening to this channel. Now let's look at it's recent action.

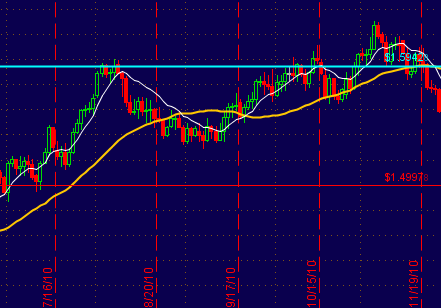
Again, it's easy to see that this channel is money. The coefficients are Fibonacci ratio's and they work really good. Let's take a closer look.

The action to the left (above) is mid September and you can see the orderly fashion in which price went down. Yesterday price broke back above the bottom line and now is holding those gains. This is bullish for the pair. I put a long term Fib retracement from 2008 - 2009 and here's what I came up with.

As you can see below these levels have been respected time and time again.. Click to enlarge any of these and you'll see.
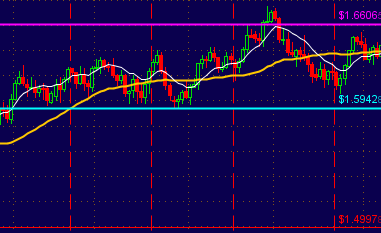
A look at the recent action with both the channel and the retracement on the charts and you see we have some space to run but some resistance to get through also.

Now lets look at the pattern forming in the most recent action. You probably see it already, there's a bull flag on the chart. Here's what that looks like along with the projected target of the BF:

Depending on where the price breaks out at, the price target may move down. I just put the hypothetical target on the chart to show how it looks. the target is just a measurement of the flag pole. To trade this you would wait for a breakout and then a 2 or 3 % pop where usually you'll get a pull back and test of that upper flag trend line. You would buy the bounce off that trend line test. If price closes under that trend line for any reason it negates the whole pattern. put your stop 10-15 ticks below the top flag trend line
Whenever the breakout happens if the breakout happens if the target coincides with a fib retracement or the top of the channel it lends more validity to the set up. Any questions or if you see something that looks out of kilter, or you need help drawing the channel on your own charts please don't hesitate to bring it up!
Full disclosure, I'm long this pair already... (update, not even 3 minutes after i posted this GBP/USD is cracking down a bit, need to get flat but this pattern is valid as long as price stays in the flag! (update on the update! I'm back long! the whip saw reversed higher!)
Good luck and happy hunting traders!

 RSS Feed